
An EV charging station in Brazil offers significant investment potential. The Profitability of EV Charging Station hinges on a detailed analysis of costs and revenue streams tailored to the local market. Success depends on strategic financial planning.
Brazil’s EV market value is projected to grow from USD 1,805.9 million in 2024 to over USD 5,332.8 million by 2029, showcasing rapid expansion.

This growth creates a prime opportunity for a charging station business. Achieving profitability requires a clear understanding of specific financial inputs. A business must evaluate options from various Hersteller von EV-Ladegeräten, einschließlich der Anbieter von fortgeschrittenen EV-Ladelösungen like TPSON, to select the right EV-Ladegerät, whether stationary or tragbare EV-Ladegeräte. This careful selection is crucial for the charging investment.
Analyzing Your Initial Investment Costs (CAPEX) in Brazil

A business must first analyze the Capital Expenditures (CAPEX) to launch a successful ev charging station. These upfront costs form the foundation of the total investment. A thorough evaluation of hardware, installation, and software is essential for building a viable financial model for the charging infrastructure in Brazil.
EV Charging Station Hardware Costs
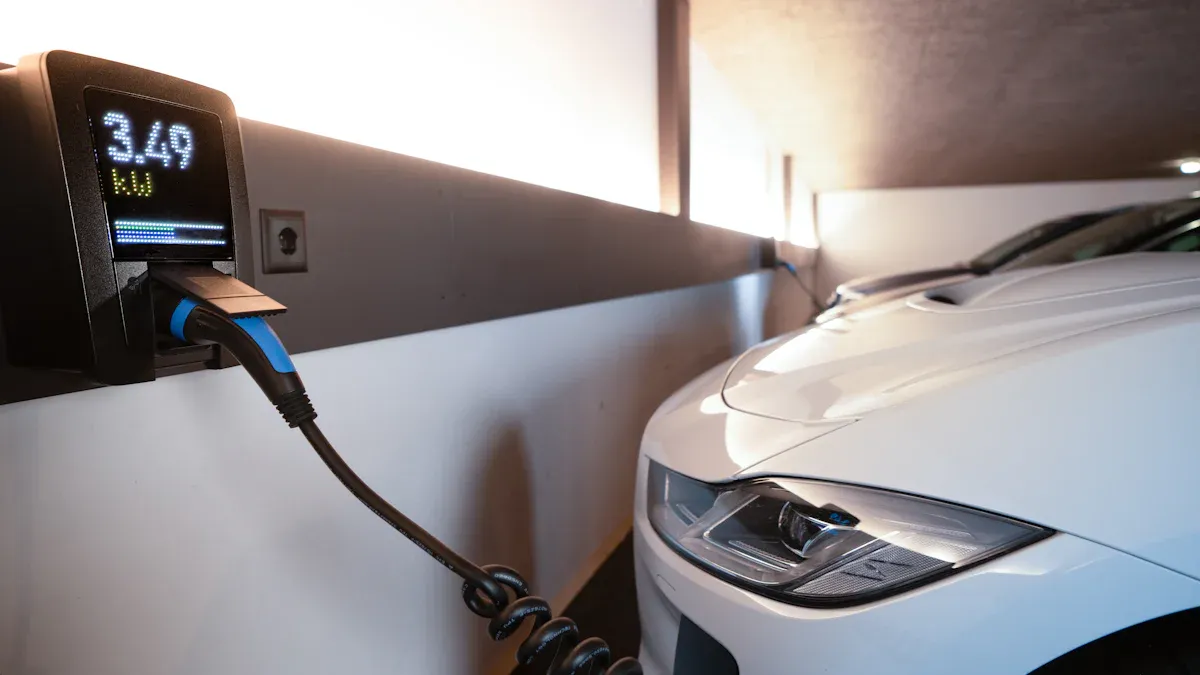
The primary hardware costs depend directly on the chosen charging technology. This decision impacts both the initial investment and the service offered to EV drivers.
Level 2 AC Chargers
Level 2 AC chargers are a cost-effective option for locations where vehicles park for extended periods. These include workplaces, hotels, and residential complexes. They provide a slower charging speed, making them suitable for overnight or all-day sessions.
DC Fast Chargers (DCFC)
DC Fast Chargers (DCFC) represent a more significant capital outlay. This advanced technology delivers rapid charging, often in under an hour. DCFC units are ideal for high-traffic public locations like highways, retail centers, and dedicated charging hubs. Companies like TPSON provide this type of sophisticated technology, which can attract more users and generate higher revenue per session.
Transformers and Electrical Switchgear
High-power charging, especially with multiple DCFC units, requires robust electrical infrastructure. This often includes new transformers, switchgear, and panels to manage the increased electrical load safely. These components are critical for the stability and capacity of the charging site.
Site Preparation and Installation Expenses
Installation costs can vary significantly based on site conditions in Brazil. These expenses are a major part of the initial budget.
Electrical Work and Grid Connection Fees
This category covers trenching for conduits, running high-voltage cables, and labor for certified electricians. It also includes fees paid to the local energy utility for grid upgrades and connection, which can be substantial.
Civil Works, Paving, and Groundwork
Preparing the site involves several tasks. Installers may need to pour concrete pads for the chargers, repair asphalt, and ensure proper drainage. These civil works ensure the infrastructure is secure and accessible.
Anmerkung: Site complexity is a major cost driver. A simple curb-side installation will have lower costs than a project requiring extensive trenching across a large parking lot.
Station Signage and Parking Bay Markings
Clear signage and visible parking bay markings are crucial for a positive user experience. This includes directional signs, instructional panels on the chargers, and painted EV-only parking spaces.
Software and Network Management Systems
Moderne Ladestationen arbeiten mit hochentwickelten Softwareplattformen.
Charging Station Management System (CSMS)
A CSMS is the central nervous system of the ev charging station. This software allows operators to set pricing, monitor station status, track usage, and manage users remotely.
Point-of-Sale (POS) and Payment System Integration
To collect revenue, the station needs a reliable payment system. This involves integrating hardware and software that can process various payment methods, including credit cards and popular local options like Pix.
Regulatory and Compliance Fees in Brazil
Navigating the regulatory framework in Brazil is a non-negotiable step for any business. These compliance requirements protect the public and ensure fair market practices. The associated fees and administrative processes are important costs that a business must factor into its initial investment budget. Proper planning for these legal hurdles prevents future fines and operational delays.
ANEEL Registration and Authorization
The National Electric Energy Agency (ANEEL) oversees the energy sector. ANEEL Resolution No. 1,000/2021 establishes the guidelines for EV charging activities. Businesses planning to offer commercial charging services must register their activity with the agency.
Key ANEEL Guideline: While ANEEL does not regulate the final price charged to the EV driver, it requires service providers to adhere to technical and safety standards. Registration ensures the operation is officially recognized and compliant with national energy policies.
This process formalizes the business as a legitimate charging service provider. Choosing hardware from technologisch fortschrittliche Anbieter like TPSON can help meet the technical specifications required for a smooth authorization process.
Municipal Permits (Operating Licenses)
Every commercial operation needs local government approval. The primary permit is the Operating License, or Operating License, issued by the municipal authority (municipal authority). Obtaining this license involves several steps:
- Submitting the company’s registration documents (CNPJ).
- Providing proof of property ownership or a lease agreement.
- Securing an inspection certificate from the fire department (fire department).
Additional permits for construction (Construction Permit) may be necessary if the site requires significant modifications. These local requirements vary between cities, making it essential to consult with the specific municipality where the station will be located. These permits represent tangible costs for the business.
Environmental Licensing Requirements
The scale of the charging station project determines the need for environmental licensing. Large-scale installations, especially those requiring new construction or extensive groundwork, may need an environmental permit from the state or municipal environmental agency. This process assesses the project’s potential impact on the local environment. The licensing procedure can be complex and add time and expense to the overall investment. A business must investigate these specific requirements early in the planning phase to avoid unforeseen complications and ensure the project is environmentally sustainable.
Projecting Annual Operating Costs (OPEX)
After accounting for the initial investment, a business must project its annual operating expenditures (OPEX). These recurring costs are fundamental to determining the long-term profitability of the EV charging station. A precise OPEX calculation ensures financial sustainability and operational efficiency.
Electricity and Demand Charges in Brazil
Electricity is the single largest operating expense. The total energy costs in Brazil are composed of several factors that require careful management.
Understanding Brazilian Tariff Flags (Tariff Flags)
Die Tariff Flags system adjusts electricity prices based on national power generation conditions. A green flag indicates normal costs, while yellow and red flags signal increased prices due to factors like low reservoir levels. Businesses must monitor these flags as they directly impact the cost per kilowatt-hour.
Calculating Energy Consumption Costs (R$/kWh)
The primary cost is the direct consumption of energy. A business calculates this by multiplying the total kilowatt-hours (kWh) sold by the utility’s rate (R$/kWh). This rate fluctuates with the tariff flags and the time of day, making accurate forecasting essential for pricing strategies.
Managing Peak Demand Charges (Contracted Demand)
Commercial consumers in Brazil often face demand charges. Countries like Brazil implement these charges for industrial users, structuring them around peak-hour consumption to promote grid stability. This fee, known as Contracted Demand, is based on the highest power demand registered during a billing period, regardless of total consumption. Managing charging demand to avoid high peaks is critical for controlling these significant costs.
Maintenance, Repairs, and Service Contracts
Reliable charging infrastructure requires ongoing maintenance to ensure uptime and customer satisfaction. These costs protect the initial hardware investment.
Preventive Maintenance Plans
Scheduled maintenance is crucial for operational health. These plans include routine inspections, cleaning, and software updates for the charging equipment. A proactive approach minimizes unexpected downtime and costly emergency repairs.
On-Call Repair Services and Labor
Equipment can still fail despite preventive measures. A business must budget for on-call technician services and labor for unexpected repairs. Using reliable hardware from providers like TPSON can reduce the frequency of these incidents.
Spare Parts Inventory Management
Keeping a small inventory of critical spare parts, such as cables or connectors, can drastically reduce station downtime. This represents an upfront cost but improves the overall service reliability and user experience.
Software, Network, and Financial Fees
Modern EV charging stations rely on a network of software and financial services, each with associated recurring fees.
Monatliche CSMS-Abonnementkosten
The Charging Station Management System (CSMS) typically requires a monthly or annual subscription fee. This fee covers software access, updates, and remote support for the charging network.
Payment Gateway and Transaction Processing Fees
Every transaction incurs a fee. Payment gateways charge a percentage or a flat rate for processing credit card, debit, or Pix payments. These small costs add up quickly with high station utilization.
Interoperability and Network Roaming Fees
To attract more EV drivers, a station may join a larger charging network. This allows users from other networks to use the station, a practice known as roaming. This service often involves fees for facilitating the cross-network charging session.
General Site and Administrative Overheads
Beyond direct operational expenses, a business must account for general overheads. These administrative costs are essential for the legal and financial health of the charging station business. Proper budgeting for these items ensures the operation remains compliant and financially sound over the long term, safeguarding the investment against unforeseen financial pressures.
Site Lease or Rental Costs
Many businesses install charging stations on property they do not own. In these situations, site lease or rental payments become a significant monthly operating expense. The amount depends heavily on the location’s commercial value. A prime spot in a busy São Paulo shopping center will command a much higher rent than a location in a smaller town. Lease agreements often pass certain property-related expenses to the tenant, which requires careful review before signing. This fixed expense must be factored into the station’s pricing model to ensure profitability.
Business and Liability Insurance
Operating a public charging station carries inherent risks. A comprehensive business and liability insurance policy is non-negotiable for risk mitigation. This insurance protects the company from financial losses resulting from accidents, equipment malfunctions, or property damage. For example, it covers claims if a vehicle is damaged during a charging session or if a customer sustains an injury on-site. Insurers calculate premiums based on the station’s location, the number of chargers, and the level of public access. This is a critical recurring expense for managing operational risk and maintaining public trust.
Local Property and Service Taxes (IPTU, ISS)
Brazilian businesses face several municipal taxes that contribute to annual operating costs. The two most relevant for a charging station are the IPTU and the ISS. The Imposto Predial e Territorial Urbano (IPTU) is a property tax levied on the real estate where the station is located. Its calculation is based on several factors:
- IPTU is an annual charge calculated as a percentage of the property’s municipally appraised value, typically ranging from 0.3% to 1.5%.
- In major cities like São Paulo, the base rate for a commercial property is 1.5%.
- The property owner is legally responsible for this tax, but lease agreements frequently pass these expenses on to the tenant.
Additionally, the Imposto Sobre Serviços (ISS) is a service tax. Municipalities apply this tax to the revenue generated from the charging service itself. The rate varies by city, so businesses must consult local regulations to calculate this expense accurately.
Forecasting Revenue Streams to Maximize Profitability

A successful EV charging station relies on a smart revenue strategy. Operators must look beyond simple charging fees to maximize profit. Diversifying revenue streams is essential for financial stability and growth. A comprehensive model combines direct user payments, contractual agreements, and indirect income sources to build a strong financial foundation. This approach ensures the business can capture value from every aspect of its operation.
Direct User Charging Fees
Direct charging fees are the most straightforward source of income. The flexibility of modern systems, like those from advanced providers such as TPSON, allows operators to implement various pricing structures.
Pay-Per-Use Models (R$/kWh)
This is the most transparent pricing model. Customers pay for the exact amount of energy they consume, measured in kilowatt-hours (kWh). It directly ties the price to the service delivered, making it easy for users to understand and fair for the operator.
Time-Based Billing (R$/minute)
Operators can charge customers based on the duration of the charging session. This model is effective for high-demand locations with DC fast chargers. It incentivizes drivers to move their vehicles promptly after charging, increasing station turnover.
Pauschale Sitzungsgebühren
A flat-rate model charges a single, fixed price for a complete charging session. This option offers simplicity for both the customer and the operator. It works well in locations where charging times are predictable, such as workplaces or hotels.
Recurring and Contractual Revenue Models
Securing predictable income stabilizes cash flow and is key to long-term profitability.
Monthly or Annual Subscription Plans
Offering subscription plans to frequent users creates a loyal customer base. Subscribers pay a recurring fee for a set amount of charging or discounted rates. This model generates a predictable revenue stream regardless of daily usage fluctuations.
Corporate and Fleet Charging Agreements
A business can establish contracts with companies that operate EV fleets. These agreements provide a consistent source of high-volume charging demand. They are a powerful B2B strategy that can significantly contribute to the annual revenue.
Indirect and Value-Added Revenue
Indirect revenue sources can substantially boost overall profit. An EV charging station attracts affluent, tech-savvy consumers to a location.
Tipp: The time an EV driver spends waiting for their vehicle to charge is a valuable opportunity. This “dwell time” can be monetized through various creative channels.
On-Site Digital Advertising Screens
Chargers equipped with digital screens can display advertisements. Operators can sell this ad space to other companies, creating an additional income stream.
Partnerships with Local Retail Businesses
An operator can partner with nearby cafes, shops, or restaurants. These partnerships could involve offering charging discounts to customers of the partner business, driving traffic to both establishments.
Increased Sales for Your Primary Business
For retailers, hotels, or restaurants, the primary financial benefit may come from increased customer traffic. An EV driver is likely to shop or dine while their vehicle is charging, directly increasing sales for the host business.
Leveraging Brazilian Government Incentives
Governments in Brazil offer financial incentives to encourage sustainable investments. Businesses can significantly improve their financial outlook by leveraging these programs. These incentives reduce initial costs and can enhance long-term revenue potential. A thorough investigation into available federal, state, and municipal benefits is a critical step in the financial planning process. These programs make the adoption of green technology more accessible and profitable.
Federal Tax Credits for Green Technology
The federal government provides tax incentives for companies investing in sustainable solutions. Programs like the Support Program for the Technological Development of the Semiconductor Industry (PADIS) can lower the tax burden on imported electronic components. This is highly relevant for businesses purchasing advanced charging stations.
Profi-Tipp: Partnering with a provider like TPSON, known for its sophisticated technology, can help a business meet the technical criteria required for certain federal benefits. These incentives effectively reduce the total capital expenditure.
Qualifying for these programs requires careful documentation and adherence to specific regulations. The financial relief from these incentives makes a substantial difference in the project’s initial affordability.
State-Level ICMS Reductions and Exemptions
Each state in Brazil has the authority to adjust the Imposto sobre Circulação de Mercadorias e Serviços (ICMS), a tax on goods and services. Several states offer ICMS reductions or complete exemptions for equipment related to renewable energy and electric mobility. This directly impacts the cost of purchasing EV chargers. Key benefits include:
- A lower final price for charging hardware.
- Reduced tax burden on related electrical components.
- Improved cash flow during the initial investment phase.
Businesses must consult the specific regulations within their state of operation. These state-level incentives are powerful tools for lowering the barrier to entry for new charging station operators.
Municipal Incentive Programs (e.g., Green IPTU)
Local municipalities offer some of the most direct financial incentives. A prominent example is the “Green IPTU” (Green IPTU) program. Cities use this initiative to grant discounts on the annual property tax (Imposto Predial e Territorial Urbano) to property owners who implement eco-friendly measures. Installing EV charging stations is often a qualifying action. The discount percentage varies by city but provides a recurring annual saving, directly boosting the net operating revenue. These local incentives reward businesses for contributing to urban sustainability goals.
Strategic Planning for Maximum Profitability in Brazil
Strategic planning is the cornerstone of a successful charging station business. Beyond costs and revenue, a business must analyze the market, select the right location, and choose a suitable operational model. This foresight maximizes the profitability of the charging infrastructure investment in Brazil.
Location Analysis and Site Selection
The adage “location, location, location” is especially true for EV charging. The right site directly drives utilization and revenue. A thorough analysis identifies areas with high charging demand.
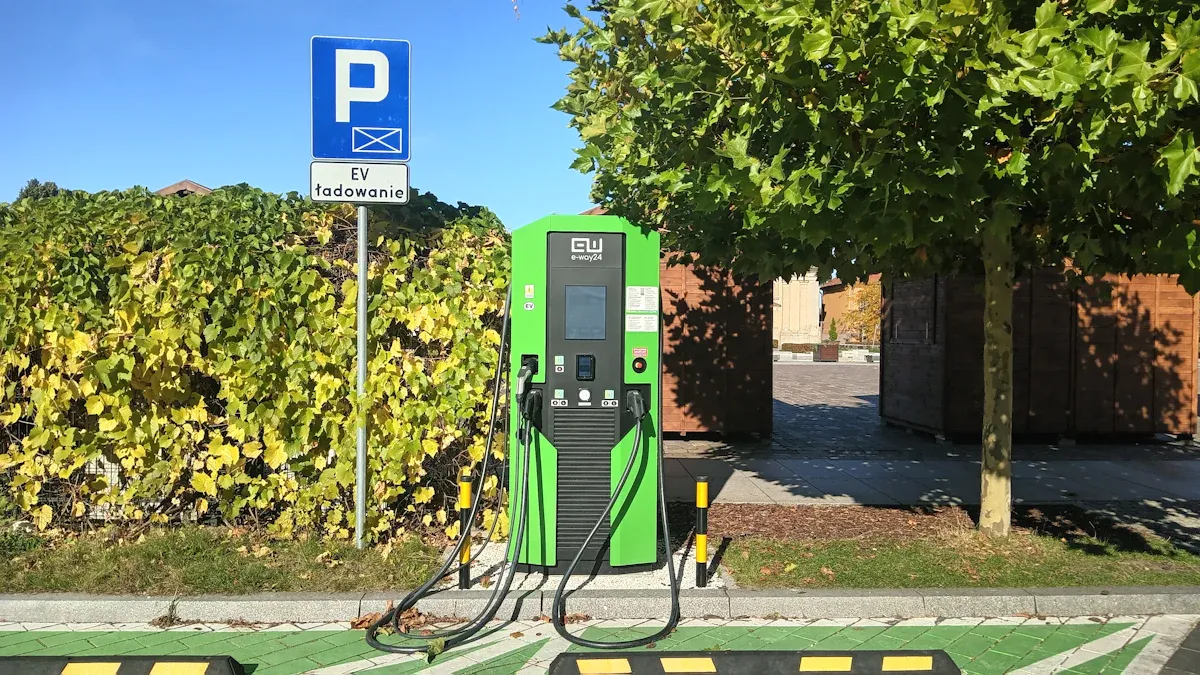
High-Traffic Commercial Zones
Placing chargers in busy commercial areas ensures a steady stream of potential customers. These high-traffic locations are ideal for capturing demand from shoppers and commuters.
- Shopping malls
- Supermärkte
- Urban business districts
Partnerships with retail centers can create a mutually beneficial relationship. The charging station attracts EV drivers, who then spend time and money at the retail location.
Residential Condominiums and Buildings
Residential buildings offer a consistent and predictable user base. Many EV owners prefer the convenience of overnight charging at home. Installing infrastructure in condominiums provides a valuable amenity for residents and a reliable revenue source for the operator.
Intercity Highway Corridors
Highways are critical for enabling long-distance EV travel. DC fast chargers, like those from advanced providers such as TPSON, are essential along these routes. They cater to travelers needing a quick charge to continue their journey, making these sites highly valuable.
Understanding the EV Market in Brazil
A deep understanding of the local electric vehicle market is crucial. Brazil is a key emerging market in Latin America, with government incentives and growing environmental awareness fueling rising EV adoption rates. A charging station business must align its strategy with market trends.
Current and Projected EV Adoption Rates
Operators should monitor regional EV ownership data. This information helps forecast future charging demand and ensures the infrastructure is built in areas with a growing number of electric vehicles, avoiding underutilization.
Dominant Vehicle Models and Connector Types
Different EV models use different charging connectors. A business must research the most popular vehicles in the market to offer the correct charging options. Providing the right connectors ensures compatibility for the largest possible customer base.
Competitor Analysis and Pricing
Analyzing the competition is a vital step. An operator should identify other charging stations in the area, evaluate their pricing strategies, and assess their service quality. This analysis helps set competitive prices and identify service gaps in the market.
Choosing the Right Business Model
The right business model depends on an organization’s capital, expertise, and goals.
Owner-Operator Model
In this model, the business owns and manages the entire operation. It retains all the revenue but also bears all the costs and responsibilities. This offers the highest potential for profit.
Charging as a Service (CaaS) Model
The CaaS model involves a third-party company handling the installation, operation, and maintenance of the charging station. The site host pays a regular fee, making it a hassle-free option for businesses that want to offer EV charging as an amenity.
Host-Owned Revenue Share Model
This hybrid model involves the site host purchasing the equipment while a network operator manages it. The two parties then share the revenue generated from charging sessions.
Calculating the Profitability of an EV Charging Station
With a clear understanding of costs and potential revenue streams, a business can now perform the central financial analysis. This calculation synthesizes all financial data into clear metrics that define the profitability of an EV charging station. The process involves using core formulas to determine net income, return on investment, and the payback period for the project.
The Core Profitability Formula
The foundation of any financial projection is a simple yet powerful formula. It measures the difference between money coming in and money going out. This calculation reveals the core operational profit of the charging business.
Calculating Annual Gross Revenue
Annual gross revenue represents the total income generated by the ev charging station before any expenses are deducted. An operator calculates this figure by summing up all sources of income over a 12-month period.
- Direct Charging Fees: (Price per kWh/minute/session) x (Number of sessions)
- Subscription Revenue: (Monthly/Annual Fee) x (Number of subscribers)
- Fleet Contract Revenue: Income from corporate charging agreements
- Indirect Revenue: Advertising sales and partnership fees
This final number is the top line of the profitability statement. A strong annual revenue is essential for a healthy business.
Calculating Total Annual OPEX
Total Annual Operating Expenditures (OPEX) are the recurring costs required to keep the station running. A business calculates this by adding up all operational expenses incurred over one year. These costs include electricity, maintenance, software subscriptions, insurance, and taxes.
Total OPEX = Electricity Costs + Maintenance + Software Fees + Insurance + Taxes + Lease + Other Overheads
Accurate OPEX tracking is critical for managing the business’s financial health and identifying areas for cost savings.
Determining Net Operating Income
Net Operating Income (NOI) is the most direct measure of profit from the station’s core operations. It is the amount of revenue left after all operating expenses have been paid. The formula is straightforward:
Net Operating Income (NOI) = Annual Gross Revenue - Total Annual OPEX
A positive NOI indicates that the ev charging station is operationally profitable. This figure is the basis for evaluating the investment’s overall success and calculating financial returns.
Return on Investment (ROI) and Payback Period
NOI helps a business understand annual profitability, but investors also need to know how the project performs relative to the initial capital invested. ROI and the payback period are the two key metrics for this evaluation.
The ROI Calculation: Net Operating Income / Total CAPEX
Return on Investment (ROI) measures the efficiency of an investment. It shows the annual returns as a percentage of the initial cost. A higher ROI signifies a more profitable venture.
The Formula for Return on Investment:
ROI (%) = (Net Operating Income / Total CAPEX) x 100
This percentage allows investors to compare the profitability of public ev fast-charging stations against other potential investments.
Calculating Your Payback Period in Years
The payback period is the length of time it takes for an investment to generate enough profit to recover its initial cost. A shorter payback period means lower risk and faster returns.
Payback Period (Years) = Total CAPEX / Net Operating Income
This metric provides a clear timeline for when the initial capital expenditure will be fully recouped, after which the project generates pure profit.
A Practical Calculation: Public EV Fast-Charging Stations in São Paulo
Let’s apply these formulas to a hypothetical scenario. An operator decides to install two 120 kW public ev fast-charging stations in a high-traffic commercial area in São Paulo. This example demonstrates the potential profitability of public ev fast-charging stations.
Hypothetical CAPEX Breakdown
The initial investment includes hardware, installation, and regulatory fees. The operator chooses advanced DCFC units to ensure high performance and reliability, similar to technology from providers like TPSON.
| CAPEX Item | Cost per Unit (R$) | Menge | Total Cost (R$) |
|---|---|---|---|
| 120 kW DC Fast Charger | R$ 250,000 | 2 | R$ 500,000 |
| Transformer & Switchgear | R$ 80,000 | 1 | R$ 80,000 |
| Installation & Civil Works | R$ 60,000 | 2 | R$ 120,000 |
| Software & POS Integration | R$ 15,000 | 1 | R$ 15,000 |
| Permits & ANEEL Fees | R$ 10,000 | 1 | R$ 10,000 |
| Total CAPEX | R$ 725,000 |
Sample OPEX and Revenue Projections
Next, the operator projects the annual revenue and costs for the two public ev fast-charging stations.
Annahmen:
- Utilization: Each station is used for 6 charging sessions per day.
- Energy per Session: Average of 40 kWh per EV charging session.
- Price: R$ 2.50 per kWh.
- Operating Days: 365 days per year.
| Annual Projections | Berechnung | Total (R$) |
|---|---|---|
| Jährliche Einnahmen | (2 stations x 6 sessions/day x 40 kWh/session x R$ 2.50/kWh x 365 days) | R$ 438,000 |
| Jährliche OPEX | ||
| Electricity Costs (45% of revenue) | R$ 438,000 x 0.45 | R$ 197,100 |
| Maintenance (3% of CAPEX) | R$ 725,000 x 0.03 | R$ 21,750 |
| Software & Network Fees | R$ 1,500/month x 12 | R$ 18,000 |
| Insurance & Taxes (ISS @ 5%) | R$ 5,000 + (R$ 438,000 x 0.05) | R$ 26,900 |
| Total Annual OPEX | R$ 263,750 |
Calculating the Final ROI and Payback
With all the figures in place, the final calculation reveals the profitability of the public ev fast-charging stations.
Calculate Net Operating Income (NOI):
NOI = Annual Revenue - Total Annual OPEX
NOI = R$ 438,000 - R$ 263,750
NOI = R$ 174,250
Calculate Return on Investment (ROI):
ROI = (NOI / Total CAPEX) x 100
ROI = (R$ 174,250 / R$ 725,000) x 100
ROI = 24.03%
Calculate Payback Period:
Payback Period = Total CAPEX / NOI
Payback Period = R$ 725,000 / R$ 174,250
Payback Period = 4.16 Years
This analysis shows a strong return on investment and a reasonable payback period, confirming the high profitability of public ev fast-charging stations in a prime Brazilian market. This financial model underscores the importance of strategic planning for achieving long-term profitability.
Key Performance Indicators (KPIs) to Monitor
After calculating initial profitability, a business must continuously monitor its performance. Key Performance Indicators (KPIs) are essential metrics that provide insight into the operational health and financial success of the charging station. Tracking these indicators allows an operator to make data-driven decisions, optimize efficiency, and maximize long-term returns.
Auslastungsrate der Station
The station utilization rate measures how often the charging equipment is in use. It is a direct indicator of demand and operational efficiency. A low rate may signal poor location choice or insufficient marketing, while a very high rate might suggest an opportunity for expansion.
Formula for Utilization Rate:
Utilization Rate (%) = (Total Hours of Active Charging / Total Available Hours) x 100
Operators calculate this KPI to understand traffic patterns and schedule maintenance during off-peak hours. Improving this rate is fundamental to increasing the overall profitability of the ev charging infrastructure.
Average Revenue Per Charging Session
This KPI reveals the average income generated from each customer transaction. It helps an operator evaluate the effectiveness of its pricing strategy. A business can track this metric to see how changes in billing models—such as shifting from per-kWh to time-based fees—impact financial performance.
| Preismodell | Impact on Average Revenue |
|---|---|
| Per-kWh (R$/kWh) | Directly ties income to energy delivered. |
| Time-Based (R$/minute) | Can increase income at high-power DCFC stations. |
| Flat-Rate Session | Provides predictable income but may be less profitable for long sessions. |
Analyzing this figure helps fine-tune pricing to balance competitiveness with profitability.
Uptime and Reliability Percentage
Uptime is arguably the most critical operational KPI. It represents the percentage of time a charging station is fully functional and available for use. High reliability builds customer trust and encourages repeat business. Poor uptime leads to frustrated drivers and lost income. Advanced monitoring technology is crucial for tracking this metric accurately.
While Brazil is still developing its specific regulations, operators can look to international standards as a benchmark. The UK’s Public Charge Point Regulations, for example, mandate an average 99% uptime for rapid chargers across an operator’s network. Achieving this standard is challenging. A survey of UK operators revealed that only 4% reached an uptime of 99.5% or higher, though 74% reported figures above 95%. This highlights the difficulty in reaching the final percentage points due to issues like maintenance delays and grid problems. Investing in robust hardware and sophisticated diagnostic technology from providers like TPSON is a key strategy for maximizing uptime and approaching world-class reliability standards.
Customer Churn Rate for Subscription Models
For businesses offering subscription plans, the customer churn rate is a vital KPI. It measures the percentage of subscribers who cancel their service over a specific period. A high churn rate can severely damage the predictable income stream that makes subscription models attractive.
A high churn rate is a clear signal of customer dissatisfaction. It is often more expensive to acquire a new customer than to retain an existing one.
To minimize churn, an operator must focus on:
- Ensuring high station reliability and availability.
- Offering competitive pricing and clear value.
- Providing excellent customer support for the ev charging service.
Tracking this KPI helps a business understand customer loyalty and the long-term viability of its recurring revenue model. Superior technology and service are the best defenses against customer churn.
A commercial EV charging station presents a significant investment in Brazil’s green economy. The long-term profitability of an EV charging station is not guaranteed; it requires diligent planning to secure strong returns. This guide helps a charging station business build its case for positive returns. A business must analyze its unique market to ensure the profitability of EV charging. The final investment decision should deliver positive returns, strong returns, and overall profitability for the EV charging venture, ensuring excellent returns.
FAQ
What is the most significant operating cost for an EV charging station in Brazil?
Electricity is the largest recurring expense. A business must manage both direct energy consumption costs (R$/kWh) and peak demand charges (Contracted Demand). Brazilian tariff flags (Tariff Flags) also cause electricity prices to fluctuate, impacting overall operational expenditures.
How long does it typically take to see a return on investment?
The payback period varies based on location, utilization, and pricing strategy. A well-placed station in a high-traffic area like São Paulo can achieve a payback period of approximately 4 to 6 years, demonstrating the strong profitability potential of the investment.
Do I need a special permit from ANEEL to sell electricity?
An operator does not need an energy commercialization license. However, a business must register its charging activity with ANEEL. This process ensures the operation complies with national technical and safety standards for EV charging services in Brazil.
Which type of charger is better, AC or DC?
The choice depends on the location.
- AC-Ladegeräte: Best for long-duration parking like offices or hotels.
- DC-Schnellladegeräte: Ideal for high-turnover locations like highways and retail centers. A business should select the charger type that matches customer needs at the site.
Can I generate revenue beyond just charging fees? 💰
Yes. Operators can significantly boost profitability through indirect revenue streams. These include selling on-site digital advertising, forming partnerships with local retailers, and securing charging contracts with corporate EV fleets. These methods create diverse and stable income sources.
How does technology impact profitability?
Advanced technology directly improves profitability. High-quality hardware from providers like TPSON enhances station uptime and reliability, which attracts more users. Sophisticated software also enables dynamic pricing and efficient remote management, maximizing revenue and minimizing operational costs.