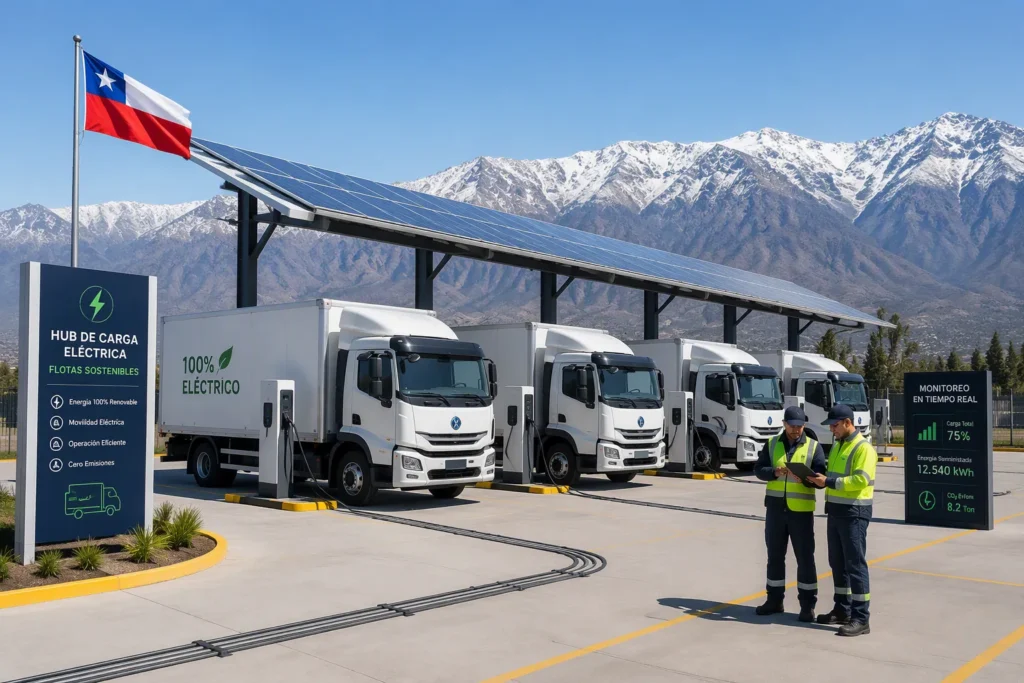
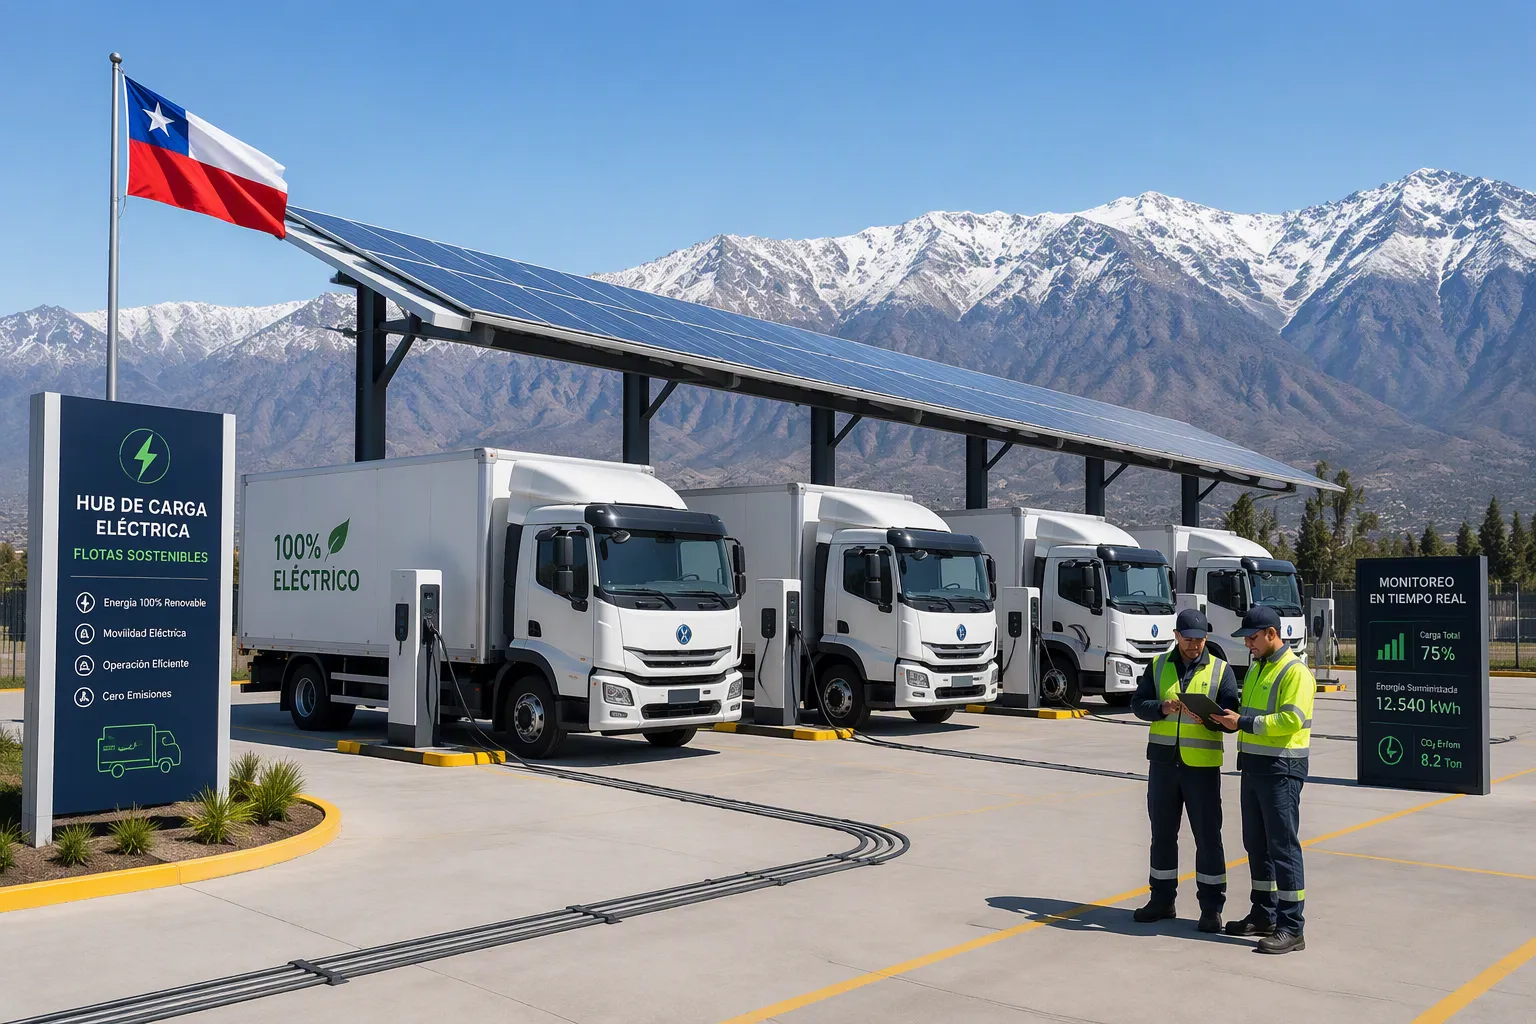
A Private Charging Hub is economically viable for fleet operators in Chile, with payback periods typically ranging from 3 to 6 years depending on fleet size, utilization, and access to incentives. Fuel and maintenance savings alone can offset up to 60–70% of the initial investment over the hub’s lifetime. Chilean government programs and falling hardware costs from الشركات المصنعة لشاحن السيارة الكهربائية make private infrastructure increasingly attractive compared to public charging or diesel. The key is matching hub capacity to fleet duty cycles and leveraging time-of-use tariffs. For a 20-vehicle fleet, a Private Charging Hub equipped with the right شاحن السيارة الكهربائية can deliver net savings of CLP 180–250 million over 10 years. Fleet operators can further optimize costs by incorporating شواحن السيارات الكهربائية المحمولة for flexible deployment and selecting حلول شحن السيارات الكهربائية tailored to their specific operational needs.
Chile’s Energy Market and the Case for Fleet Electrification
Why Chile Is a Prime Market for Fleet Electrification
Rising Diesel Costs and Price Volatility
Diesel prices in Chile fluctuate sharply due to global oil markets and import dependence. Fleet operators face unpredictable fuel budgets. Electric vehicles offer a stable alternative. Electricity rates change slowly and predictably. This stability helps commercial fleets plan long-term costs.
Abundant Renewable Energy and Falling Electricity Prices
Chile generates vast solar and wind power. The northern Atacama Desert holds some of the world’s best solar resources. Renewable energy now supplies a growing share of the grid. Grid decarbonization continues rapidly. The country plans to reduce coal plants to ten by the end of 2025. This shift lowers electricity prices over time. Cheap renewable power makes البنية التحتية للشحن more attractive for fleet electrification.
National Electromobility Strategy and Targets
Chile’s government set ambitious zero-emission targets. The table below summarizes key goals.
| Target Category | Goal |
|---|---|
| Zero-emission vehicle sales | 100% ZEV cars and public transport by 2035 |
| Interurban buses and cargo | 100% ZEV by 2045 |
| Large off-road machinery (>560 kW) | 100% ZEV by 2035 |
| Small off-road machinery (>19 kW) | 100% ZEV by 2040 |
These targets create a clear strategy for operators. The government also offers non-tax incentives. Electric bus operators gain longer contracts. Contracts extend to seven years if more than half the fleet is electric. Traditional contracts last five years. This policy rewards early adopters.
Current State of Fleet Electrification in Chile
Adoption Rates in Mining, Logistics, and Public Transport
Mining companies lead adoption. Logistics firms follow closely. Public transport shows rapid growth. Santiago finalized an order for 991 electric buses in 2021. This order raised the total to about 1,770 buses. Electric buses now make up 25% of the Santiago fleet. Chile outperforms Europe and North America in electric bus percentage.
Key Players and Early Adopters
Major mining corporations test electric haul trucks. Logistics giants pilot electric delivery vans. TPSON, a technologically advanced electric vehicle charging solution provider, supports these pilots with reliable hardware. Transport operators in Santiago and Valparaíso drive bus electrification.
Regional Differences in Infrastructure Readiness
Santiago leads in charging infrastructure. The metropolitan region offers better grid capacity. Antofagasta and mining regions show strong potential. Northern solar farms provide abundant power. Southern regions lag due to weaker grids. Operators must assess local conditions before building hubs.
The Role of Private Charging Hubs in Chile’s Transition
Limitations of Public Charging Networks
Public charging networks remain sparse. Coverage outside major cities is limited. Queuing and downtime frustrate fleet operators. Public stations often lack the power for heavy-duty vehicles. These limits make public charging unreliable for commercial fleets.
Advantages of Depot-Based Private Hubs
Private hubs offer control and reliability. Operators charge vehicles overnight at depots. This schedule uses off-peak electricity rates. Private hubs reduce downtime and detours. They also protect vehicle batteries through managed charging.
Grid Capacity and Reliability Considerations
Grid capacity varies by region. Operators must evaluate local transformer limits. Upgrades may require coordination with distribution companies. Backup power and storage add resilience. A well-planned hub ensures reliable charging for every vehicle.
Total Cost of Ownership for a Private Charging Hub
Capital Expenditures (CapEx)
Charging Hardware Costs (AC vs. DC, Power Ratings)
Hardware represents the largest upfront expense for any private charging hub. AC chargers cost less per unit and suit overnight depot charging. DC fast chargers cost significantly more but serve high-utilization fleets. The table below compares typical Chilean market prices.
| نوع الشاحن | تصنيف الطاقة | Typical Unit Cost (CLP) |
|---|---|---|
| تكييف المستوى 2 | 7-22 كيلو واط | 1.5–4 million |
| دي سي فاست | 50–150 kW | 18–45 million |
| DC Ultra-Fast | 150–350 kW | 50–90 million |
TPSON supplies durable hardware across these categories. Operators should match power ratings to vehicle battery sizes and duty cycles.
Installation and Civil Works
Installation covers trenching, cabling, mounting, and site preparation. Civil works add 15–30% to hardware costs. Depot layouts with existing conduits reduce this expense.
Grid Upgrades and Transformer Requirements
Many depots need transformer upgrades. A 20-vehicle hub may require 200–500 kVA of additional capacity. Distribution companies charge for interconnection studies and equipment. These costs vary widely by region.
Software and Energy Management Systems
An energy management system controls charging schedules and load balancing. Software licenses typically cost CLP 300,000–800,000 per charger annually. This investment enables smart energy management and reduces electricity expenses.
Operational Expenditures (OpEx)
Electricity Costs and Tariff Structures
Electricity dominates operational spending. Chilean commercial rates range from CLP 80–140 per kWh. Time-of-use tariffs reward off-peak charging. Smart scheduling cuts these costs substantially.
تكاليف الصيانة والإصلاح
Charging infrastructure requires modest maintenance. Annual servicing runs 2–4% of hardware value. Cable replacement and connector wear drive most repair expenses.
Insurance and Warranty Considerations
Operators should insure charging assets against damage and liability. Manufacturer warranties typically cover 2–5 years. Extended warranties add predictable costs.
Network Connectivity and Software Subscriptions
Cellular connectivity and cloud platforms carry monthly fees. These subscriptions enable remote monitoring and diagnostics. Budget CLP 15,000–40,000 per charger monthly.
Total Cost of Ownership Over 10 Years
Depreciation and Residual Value
Charging equipment depreciates over 8–10 years. Residual values reach 10–20% for well-maintained units. Accelerated depreciation rules improve early-year tax positions.
Cost per Kilometer Delivered
Electric fleet electrification delivers CLP 45–75 per kilometer in total charging costs. Diesel fleets spend CLP 120–180 per kilometer. This gap drives strong fleet business cases.
Sensitivity to Utilization Rates
Utilization determines commercial viability. Hubs below 30% utilization struggle to justify investment. High-utilization fleets achieve payback in 3–4 years. Operators must right-size capacity to actual vehicle demand.
Comparing TCO: Private Charging Hub vs. Public Charging vs. Diesel
Fleet operators in Chile face three primary options for powering their vehicles. Each option carries distinct cost structures. A direct comparison reveals where savings emerge and where hidden expenses lurk. This section breaks down the total cost of ownership across private charging hubs, public charging networks, and traditional diesel fuel.
Cost per Kilometer: Private Hub vs. Public Charging
Public Charging Rates in Chile (CLP/kWh)
Public charging networks in Chile charge premium rates. Operators pay between CLP 180 and CLP 350 per kWh at public stations. These rates vary by location, charger speed, and network operator. Fast chargers command higher prices than slower AC units. The table below shows typical public charging rates across major Chilean cities.
| المدينة | AC Charging (CLP/kWh) | DC Fast Charging (CLP/kWh) |
|---|---|---|
| Santiago | 180–220 | 280–350 |
| Valparaíso | 190–230 | 290–340 |
| Antofagasta | 200–250 | 300–360 |
| Concepción | 185–225 | 275–330 |
Public charging costs include network operator margins. These margins fund station maintenance and expansion. Fleet operators absorb these costs with every charging session.
Private Hub Electricity Costs (CLP/kWh)
A private charging hub draws power at commercial and industrial rates. Chilean commercial electricity prices range from CLP 80 to CLP 140 per kWh. Off-peak charging reduces these costs further. Smart scheduling shifts demand to low-rate hours. The table below compares private hub rates against public charging rates.
| طريقة الشحن | Typical Rate (CLP/kWh) | Annual Cost for 20 Vehicles (CLP) |
|---|---|---|
| Public AC | 180–250 | 90–125 million |
| Public DC Fast | 280–360 | 140–180 million |
| Private Hub (On-Peak) | 100–140 | 50–70 million |
| Private Hub (Off-Peak) | 80–110 | 40–55 million |
A private charging hub cuts electricity costs by 50–70% compared to public networks. This gap compounds over the hub’s lifetime. For a 20-vehicle fleet, annual savings reach CLP 50–90 million.
Hidden Costs of Public Charging (Downtime, Queuing, Detours)
Public charging carries hidden expenses beyond the per-kWh rate. Vehicles wait in queues during peak hours. Drivers detour to reach charging stations. These detours add kilometers and time to daily routes. Downtime reduces fleet productivity. A commercial fleet loses revenue when vehicles sit idle at public chargers. These hidden costs add CLP 15–30 per kilometer to public charging operations. A private charging hub eliminates these expenses. Vehicles charge overnight at the depot. They start each day fully charged and ready for service.
Cost per Kilometer: Private Hub vs. Diesel
Diesel Price Trends in Chile (CLP/liter)
Diesel prices in Chile fluctuate with global oil markets. The table below shows recent price trends.
| السنة | Average Diesel Price (CLP/liter) | Annual Change |
|---|---|---|
| 2020 | 650 | - |
| 2021 | 780 | +20% |
| 2022 | 1,050 | +35% |
| 2023 | 980 | -7% |
| 2024 | 1,020 | +4% |
Diesel prices rose 57% between 2020 and 2024. This volatility complicates fleet budgeting. Electric vehicles shield operators from these price swings. Electricity rates change slowly and predictably.
Maintenance Savings from Electric Powertrains
Electric powertrains require far less maintenance than diesel engines. Diesel vehicles need regular oil changes, filter replacements, and exhaust system repairs. Electric vehicles eliminate these service requirements. The table below compares maintenance costs across vehicle types.
| Maintenance Item | Diesel Vehicle (CLP/km) | Electric Vehicle (CLP/km) |
|---|---|---|
| Oil and Filters | 12–18 | 0 |
| Brake System | 8–12 | 3–5 |
| Transmission | 5–8 | 0 |
| Exhaust System | 4–7 | 0 |
| Cooling System | 3–5 | 1–2 |
| الإجمالي | 32–50 | 4–7 |
Electric vehicles save CLP 28–43 per kilometer in maintenance costs. These savings accumulate rapidly across a large fleet. A 20-vehicle fleet saves CLP 40–60 million annually on maintenance alone.
Fuel Efficiency and Duty Cycle Differences
Diesel engines perform poorly in stop-and-go traffic. Urban delivery routes waste fuel through idling and constant acceleration. Electric vehicles excel in these conditions. Regenerative braking recovers energy during deceleration. Electric motors deliver instant torque for quick acceleration. These advantages improve efficiency in urban duty cycles. High-mileage highway routes favor diesel less. Electric vehicles maintain consistent efficiency across all speeds. The table below compares energy costs per kilometer across duty cycles.
| Duty Cycle | Diesel Cost (CLP/km) | Electric Cost (CLP/km) | المدخرات |
|---|---|---|---|
| Urban Delivery | 150–180 | 45–65 | 65–75% |
| Regional Haul | 120–150 | 50–70 | 55–65% |
| Highway Long-Haul | 100–130 | 55–75 | 40–50% |
Fleet electrification delivers the greatest savings in urban and regional operations. These duty cycles dominate Chilean logistics and public transport.
Break-Even Analysis by Fleet Size
Small Fleets (5–10 Vehicles)
Small fleets face higher per-vehicle infrastructure costs. A 5-vehicle hub requires CLP 25–40 million in capital expenditure. This investment covers chargers, installation, and software. Annual savings reach CLP 15–25 million. Payback periods stretch to 4–6 years. Government incentives improve these numbers. Small fleets should start with AC chargers for overnight charging. This charging strategy minimizes upfront costs. TPSON offers scalable solutions for small fleet operators.
Medium Fleets (11–50 Vehicles)
Medium fleets achieve better economies of scale. A 20-vehicle hub costs CLP 60–100 million to build. Annual savings reach CLP 50–80 million. Payback periods shrink to 3–4 years. These fleets benefit from mixed AC and DC charging setups. DC fast chargers handle urgent daytime needs. AC chargers manage overnight charging at lower rates. Medium fleets should negotiate demand charges with their utility provider. Load management systems prevent costly peak demand spikes.
Large Fleets (50+ Vehicles)
Large fleets unlock the strongest economics. A 50-vehicle hub requires CLP 150–250 million in capital. Annual savings reach CLP 120–200 million. Payback periods fall to 2.5–3.5 years. These fleets justify dedicated transformers and grid upgrades. On-site solar and battery storage further reduce operating costs. Large fleets can also sell excess capacity to other operators. This revenue stream shortens payback periods even more. The table below summarizes break-even metrics by fleet size.
| Fleet Size | CapEx Range (CLP) | Annual Savings (CLP) | Payback Period |
|---|---|---|---|
| 5–10 Vehicles | 25–40 million | 15–25 million | 4–6 years |
| 11–50 Vehicles | 60–100 million | 50–80 million | 3–4 years |
| 50+ Vehicles | 150–250 million | 120–200 million | 2.5–3.5 years |
The cost advantage of a private charging hub grows with fleet size. Larger fleets spread infrastructure costs across more vehicles. They also negotiate better electricity rates. These factors make electrification increasingly attractive at scale.
Chilean Government Incentives and Subsidies for Charging Infrastructure
National Programs from the Energy Ministry
Electromobility Promotion Law and Tax Breaks
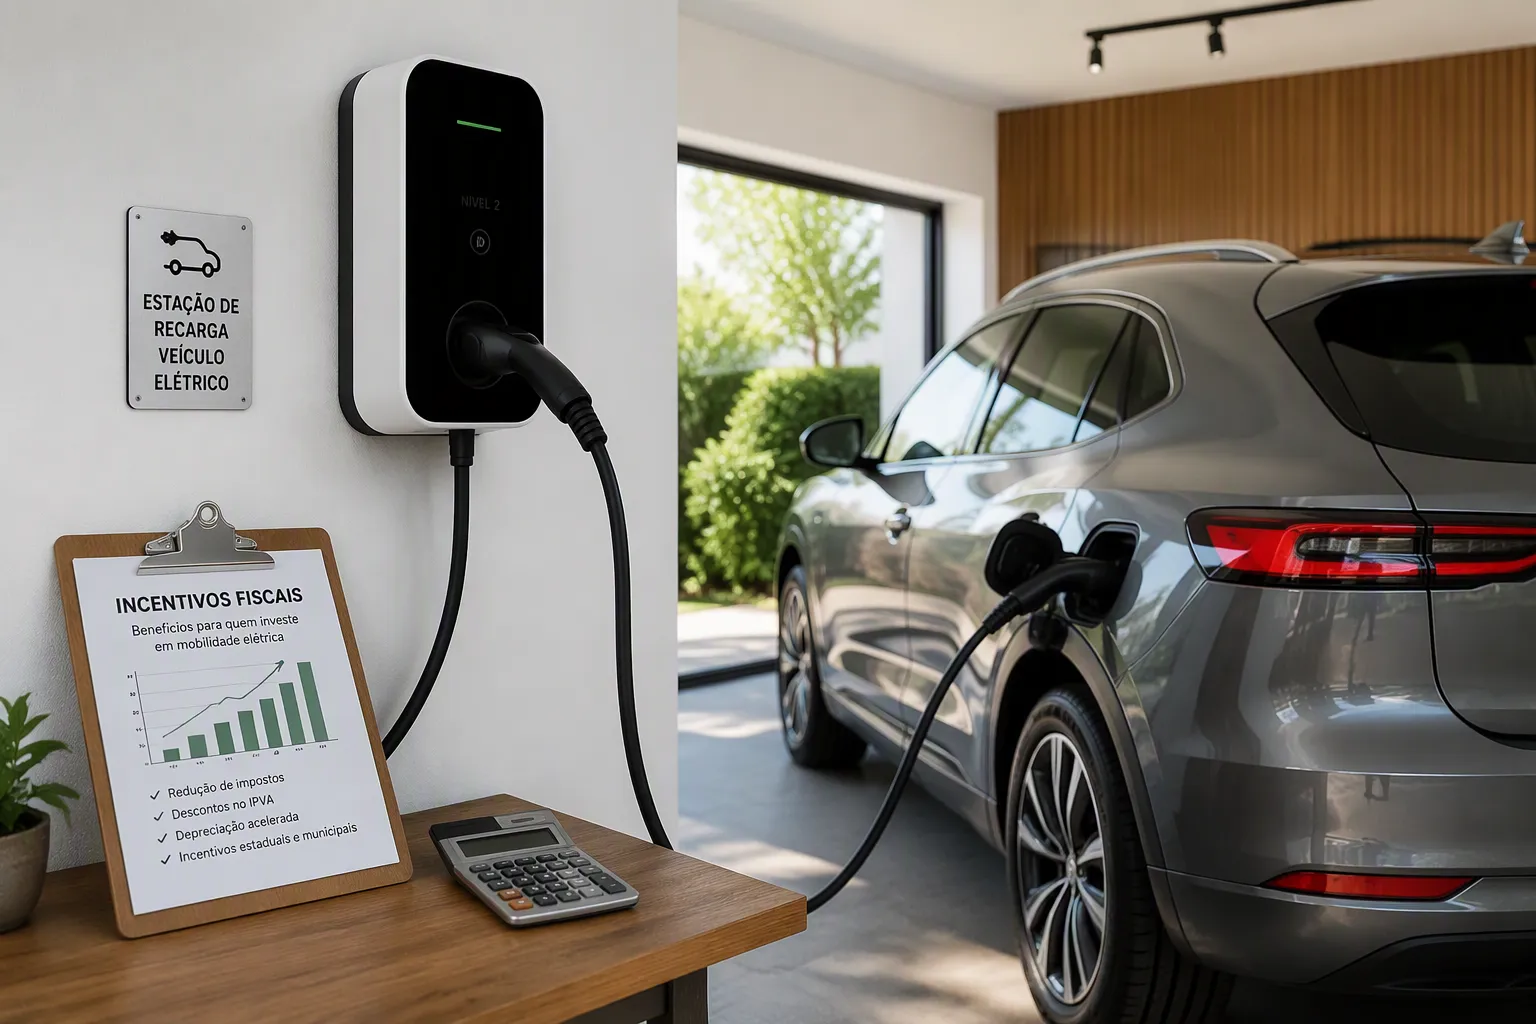
Chile’s Electromobility Promotion Law offers direct tax relief for charging infrastructure. Fleet operators can deduct a portion of equipment costs from taxable income. Electric vehicles also qualify for reduced import duties and registration fees. These breaks lower the effective cost of fleet electrification.
Green Hydrogen and Electromobility Funds
The Energy Ministry manages competitive funds for clean transport projects. These grants support charging hardware, installation, and grid upgrades. Mining and logistics companies receive priority consideration. Award amounts typically cover 20–40% of eligible project costs.
Accelerated Depreciation for Charging Infrastructure
Chilean tax law allows accelerated depreciation for charging assets. Operators can write off equipment over 3–5 years instead of the standard 10. This schedule improves cash flow during the critical early phase. It also reduces taxable income when savings are still ramping up.
Regional and Municipal Programs
Santiago Metropolitan Region Incentives
The Santiago metropolitan region offers the most mature incentive programs. Municipal grants cover up to 30% of commercial charging installation costs. The regional government also fast-tracks permits for depot-based hubs. Fleet operators in Santiago benefit from streamlined grid interconnection.
Antofagasta and Mining Region Programs
Antofagasta supports mining fleet electrification through dedicated funds. The regional government partners with mining companies on charging pilots. These programs target heavy-duty vehicles and high-power chargers. Solar integration receives additional support due to abundant local resources.
Other Regional Pilots and Grants
Valparaíso and Concepción run smaller pilot programs. These grants focus on public transport and last-mile delivery fleets. Funding levels vary by municipality. Operators should monitor regional announcements for new opportunities.
How to Apply and Qualify
Eligibility Criteria for Fleet Operators
Applicants must operate a registered commercial fleet in Chile. They need a valid depot site with confirmed grid access. Projects must meet minimum charger power and quantity thresholds. Companies with sustainability commitments receive preference.
Documentation and Application Timelines
The table below summarizes typical requirements and timelines.
| Document | الغرض | Typical Timeline |
|---|---|---|
| Fleet registration | Prove commercial status | 2–4 weeks |
| Site electrical study | Confirm grid capacity | 4–8 weeks |
| Project budget | Detail eligible costs | 2–3 weeks |
| Environmental compliance | Meet regional rules | 4–12 weeks |
Most programs open annual application windows. Operators should prepare documents months in advance.
Common Pitfalls and Tips for Success
Many applicants underestimate grid study timelines. Others submit incomplete cost documentation. TPSON, a technologically advanced electric vehicle charging solution provider, helps operators prepare technical specifications. Early engagement with distribution companies prevents delays. A clear guide to eligibility rules improves approval odds.
Optimizing Electricity Costs for Your Private Charging Hub

Time-of-Use (TOU) Tariffs in Chile
Peak vs. Off-Peak Rate Structures
Chilean utilities charge different rates based on the time of day. Peak hours typically run from 6 PM to 11 PM. Off-peak hours span from 11 PM to 8 AM. Commercial electricity rates during peak hours reach CLP 140 per kWh. Off-peak rates drop to CLP 80 per kWh. This price gap creates a clear opportunity for fleet operators.
Scheduling Charging to Minimize Costs
Operators should schedule most charging sessions during off-peak hours. An energy management system automates this process. The system monitors electricity prices in real time. It shifts charging loads to the cheapest available windows. This charging strategy cuts electricity expenses by 30–50%. Vehicles charge overnight and remain ready for morning routes.
Demand Charges and Load Management
Demand charges add another layer of cost. Utilities bill commercial customers based on their highest power draw. A sudden spike in charging demand triggers expensive penalties. Load management prevents these spikes. The system staggers charging across multiple vehicles. It spreads power draw evenly throughout the night. This approach avoids costly demand charges.
On-Site Solar and Storage Integration
Solar PV Potential in Chile
Chile offers exceptional solar resources. The Atacama Desert receives the highest solar irradiation in the world. Even central regions enjoy strong solar potential. On-site charging stations powered by solar panels reduce grid dependence. A 100 kW solar array generates 150,000–200,000 kWh annually. This output covers 20–30% of a medium fleet’s energy needs.
Battery Storage for Peak Shaving
Battery storage systems store excess solar energy during the day. They discharge power during peak rate periods. This strategy eliminates peak demand charges. Storage also provides backup power during grid outages. The table below compares energy costs with and without storage.
| التكوين | Peak Rate Cost (CLP/kWh) | Off-Peak Cost (CLP/kWh) |
|---|---|---|
| Grid Only | 140 | 80 |
| Grid + Storage | 80 | 80 |
Hybrid Systems and Grid Independence
Hybrid systems combine solar, storage, and grid power. These systems maximize renewable energy use. They also reduce exposure to grid price volatility. Some operators achieve near-total grid independence. TPSON provides hardware compatible with hybrid configurations.
Power Purchase Agreements (PPAs) and Renewable Contracts
Corporate PPAs for Fleet Operators
Corporate PPAs lock in electricity prices for 5–15 years. Fleet operators sign direct contracts with renewable generators. These agreements provide price certainty and shield against market volatility. PPA rates typically range from CLP 50–70 per kWh.
Green Certificates and Sustainability Reporting
Renewable energy contracts include green certificates. These certificates document the environmental attributes of electricity. Operators use them for sustainability reporting. Mining companies and logistics firms increasingly require this documentation.
Negotiating Rates with Generators
Operators should negotiate PPA terms carefully. Volume commitments and contract length influence pricing. Aggregating demand across multiple depots strengthens bargaining power. Early engagement with generators secures better rates.
Payback Period and ROI Framework for Your Charging Hub
A sound financial framework turns charging hub investments into defensible business decisions. Fleet operators need clear metrics to justify capital allocation. This section provides practical tools for evaluating payback periods, net present value, and financing options. Each method builds on the cost data from earlier sections. Together, these tools form a complete investment evaluation guide for Chilean fleet operators.
Simple Payback Calculation
Formula and Inputs (CapEx, Annual Savings, OpEx)
The simple payback formula divides initial capital by annual net savings. The result shows how many years pass before cumulative savings equal the upfront investment. Three inputs drive this calculation. Capital expenditure covers hardware, installation, grid upgrades, and software. Annual savings include fuel cost reductions and maintenance savings. Operational expenditure captures electricity, servicing, insurance, and subscriptions. The formula reads as follows: simple payback period = total CapEx / (annual savings minus annual OpEx). A shorter payback period signals a more attractive investment. Most Chilean fleet operators target payback within 3 to 6 years.
Example Calculation for a 20-Vehicle Fleet
Consider a logistics company in Santiago with 20 delivery vans. The operator builds a private charging hub at the central depot. The table below summarizes the key financial inputs.
| Financial Input | Amount (CLP) |
|---|---|
| Total CapEx | 80 million |
| Annual fuel savings | 65 million |
| Annual maintenance savings | 18 million |
| Annual electricity costs | 42 million |
| Annual software and insurance | 8 million |
| Net annual savings | 33 million |
The operator calculates simple payback as 80 million divided by 33 million. The result equals 2.4 years. This figure falls well within the target range. Government incentives would shorten the period further. A 30% installation grant would reduce CapEx to 56 million. Payback would then drop to 1.7 years.
Interpreting the Results
A payback period under 3 years signals strong economic viability. Periods between 3 and 5 years remain acceptable for most commercial fleets. Periods beyond 6 years require careful justification. Operators should compare payback against vehicle lifecycle expectations. Electric vehicles typically serve 8 to 12 years in commercial duty. A 4-year payback leaves 4 to 8 years of pure savings. This margin protects against technology changes and market shifts. Operators should also account for residual value at the end of the analysis period.
Net Present Value (NPV) and Internal Rate of Return (IRR)
Discount Rates and Hurdle Rates for Chilean Fleets
Simple payback ignores the time value of money. NPV and IRR correct this limitation. Both metrics discount future cash flows to present value. The discount rate reflects the opportunity cost of capital. Chilean fleet operators typically apply discount rates between 8% and 14%. Companies with higher capital costs use higher rates. Mining firms often apply 10% to 12% due to capital intensity. Logistics companies may use 8% to 10%. The hurdle rate represents the minimum acceptable return. Most Chilean fleets set hurdle rates at 12% to 15% for infrastructure projects. A project must exceed this threshold to receive approval.
Sensitivity Analysis (Electricity Prices, Utilization, Incentives)
Sensitivity analysis tests how changes in key variables affect returns. Three factors drive the most uncertainty. Electricity prices fluctuate with market conditions and tariff reforms. Utilization rates depend on fleet operations and vehicle availability. Government incentives may change with political cycles. The table below shows how each factor affects a 20-vehicle fleet’s NPV.
| السيناريو | NPV Change | IRR Change |
|---|---|---|
| Electricity prices rise 20% | -15% | -2.1% |
| Utilization drops to 60% | -28% | -3.8% |
| No government incentives | -22% | -2.9% |
| All negative factors combined | -52% | -7.2% |
Operators should stress-test their models against these scenarios. A project that survives combined negative factors offers robust returns. TPSON provides energy management tools that help operators maximize utilization and minimize electricity costs.
Comparing ROI with Other Capital Investments
Fleet operators evaluate charging hubs against alternative investments. Traditional options include fleet expansion, facility upgrades, and financial instruments. The table below compares typical returns across investment categories.
| Investment Type | Typical IRR | Risk Level |
|---|---|---|
| Private charging hub | 18–28% | متوسط |
| Fleet expansion | 12–18% | Medium-High |
| Facility upgrades | 8–12% | منخفضة |
| Chilean bonds | 5–7% | منخفضة |
| Real estate | 7–10% | متوسط |
A private charging hub delivers competitive returns with moderate risk. The investment also supports sustainability goals. Many Chilean companies now prioritize environmental performance in capital planning. This alignment strengthens the business case beyond pure financial returns.
Financing Options for Private Charging Hubs
Bank Loans and Green Financing
Chilean banks offer commercial loans for charging infrastructure projects. Interest rates range from 8% to 14% annually. Loan terms typically span 5 to 10 years. Green financing products provide better terms for qualified projects. BancoEstado and other institutions offer reduced rates for electromobility investments. These products recognize the environmental benefits of fleet electrification. Operators should prepare detailed financial models before approaching lenders. A clear payback analysis strengthens loan applications significantly.
Leasing and Charging-as-a-Service Models
Leasing shifts upfront costs to monthly payments. Operators avoid large capital outlays while gaining immediate access to charging hardware. Lease terms usually run 3 to 7 years. Charging-as-a-Service models go further. The provider owns and operates the entire hub. The fleet operator pays per kilowatt-hour delivered. This model eliminates technology risk and maintenance responsibilities. It also preserves capital for core business activities. TPSON supports both leasing arrangements and service-based deployments.
الشراكات بين القطاعين العام والخاص
Public-private partnerships combine government support with private operation. These structures suit large-scale projects at ports, industrial parks, and transport corridors. The public partner provides land, permits, or partial funding. The private partner manages construction and daily operations. Revenue sharing arrangements vary by project. Chilean mining regions have explored these models for shared charging facilities. Public-private partnerships reduce individual operator risk. They also accelerate infrastructure deployment across regions.
Case Examples and Benchmarks from Chile
Mining Fleet Electrification in Antofagasta
Project Overview and Fleet Size
A copper mining operator in Antofagasta electrified 15 heavy-duty haul trucks and support vehicles. The company built a private charging hub near its extraction site. Abundant solar resources in the region supported the project.
CapEx and OpEx Breakdown
The table below summarizes the project’s costs.
| فئة التكلفة | Amount (CLP) |
|---|---|
| DC fast chargers (8 units) | 280 million |
| Installation and civil works | 65 million |
| Grid upgrades | 45 million |
| Energy management software | 12 million |
| Annual electricity costs | 95 million |
| Annual maintenance | 18 million |
TPSON supplied durable charging hardware suited to the harsh desert environment.
Payback Period and Lessons Learned
The project achieved payback in 3.8 years. Diesel savings drove most of the return. The operator learned that early grid coordination prevents delays. Solar integration also reduced electricity costs by 25%.
Last-Mile Delivery Fleet in Santiago
Project Overview and Fleet Size
A logistics company in Santiago electrified 25 delivery vans for urban routes. The operator installed a mix of AC and DC chargers at its central depot.
CapEx and OpEx Breakdown
| فئة التكلفة | Amount (CLP) |
|---|---|
| AC chargers (20 units) | 45 million |
| DC fast chargers (3 units) | 75 million |
| Installation and civil works | 28 million |
| Annual electricity costs | 52 million |
| Annual maintenance | 9 million |
Payback Period and Lessons Learned
The hub reached payback in 3.2 years. Off-peak charging cut electricity expenses significantly. The operator learned that load management prevents costly demand charges. Scheduling software proved essential for cost control.
Public Transport Fleet in Valparaíso
Project Overview and Fleet Size
A transport operator in Valparaíso electrified 40 public buses. The company built a depot-based hub with overnight charging capacity.
CapEx and OpEx Breakdown
| فئة التكلفة | Amount (CLP) |
|---|---|
| AC chargers (35 units) | 80 million |
| DC fast chargers (5 units) | 120 million |
| Installation and civil works | 42 million |
| Annual electricity costs | 78 million |
| Annual maintenance | 14 million |
Payback Period and Lessons Learned
The project achieved payback in 4.1 years. Extended bus contracts improved the business case. The operator learned that right-sizing capacity to route schedules maximizes utilization. This commercial approach to charging infrastructure delivered reliable returns.
Key Benchmarks and Performance Metrics
Cost per Kilometer Across Sectors
Chilean fleet operators measure charging hub performance through cost per kilometer delivered. This metric varies by sector and duty cycle. The table below summarizes benchmark data from operating hubs across Chile.
| Sector | Cost per Kilometer (CLP) | Primary Duty Cycle |
|---|---|---|
| Mining (Antofagasta) | 55–75 | Heavy haul, high torque |
| Last-Mile Delivery (Santiago) | 45–60 | Urban stop-and-go |
| Public Transport (Valparaíso) | 50–65 | Fixed routes, scheduled |
| Regional Logistics | 60–80 | Mixed highway and urban |
Mining operations face higher costs due to heavy loads and rough terrain. Urban delivery fleets achieve the lowest costs through regenerative braking and frequent stops. Public transport falls in the middle range with predictable route patterns. These benchmarks help operators set realistic cost targets before construction begins.
Utilization Rates and Uptime
Utilization rates determine hub profitability. Successful Chilean hubs achieve 60–75% utilization during operational hours. This figure represents the percentage of time chargers actively deliver power. Hubs below 40% utilization struggle to justify investment. Uptime measures charger availability for vehicle charging. Top-performing hubs maintain 97–99% uptime. TPSON hardware supports these reliability levels through robust engineering and remote diagnostics. Operators should track both metrics monthly. Low utilization signals overbuilt capacity. Poor uptime points to maintenance gaps or software issues. Both problems require immediate attention.
Maintenance Cost Savings
Electric powertrains deliver substantial maintenance savings over diesel equivalents. Chilean operators report 60–75% reductions in scheduled service costs. Regenerative braking extends brake pad life by 50–70%. Electric motors eliminate oil changes, filter replacements, and exhaust repairs. The table below compares annual maintenance costs for a 20-vehicle fleet.
| Maintenance Category | Diesel Fleet (CLP) | Electric Fleet (CLP) |
|---|---|---|
| Scheduled Service | 28–35 million | 6–9 million |
| Brake System | 8–12 million | 3–5 million |
| Powertrain Repairs | 10–15 million | 2–4 million |
| Total Annual | 46–62 million | 11–18 million |
These savings compound across the hub’s lifetime. A 20-vehicle fleet saves CLP 35–44 million annually on maintenance alone. Operators should document these savings for future capital planning. Strong maintenance performance strengthens the business case for additional charging infrastructure.
Risks, Challenges, and Mitigation Strategies
Grid Capacity and Interconnection Delays
Assessing Local Grid Limitations
Grid capacity varies significantly across Chilean regions. Operators must conduct a detailed electrical study before committing to a site. This study identifies transformer limits and available power. It also reveals potential bottlenecks during peak demand periods. A thorough assessment prevents costly surprises during construction.
Working with Distribution Companies
Distribution companies control grid access and interconnection timelines. Operators should engage these companies early in the planning process. Early engagement secures queue positions for capacity requests. It also clarifies technical requirements and fee structures. Building strong relationships with utility representatives accelerates approvals. TPSON supports operators with technical documentation for these negotiations.
Backup Power and Resilience Planning
Grid outages disrupt commercial operations. Backup power systems protect against these disruptions. Battery storage provides immediate backup during short outages. Diesel generators offer longer-term resilience for critical sites. Operators should size backup systems to cover essential charging needs. This planning ensures fleet vehicles remain available during grid failures.
Technology Obsolescence and Upgrades
Choosing Scalable and Modular Hardware
Charging technology evolves rapidly. Operators should select modular hardware that supports future expansion. Modular designs allow incremental power upgrades without full replacement. They also simplify maintenance and reduce downtime. TPSON designs charging solutions with scalability in mind.
Software Updates and Compatibility
Software platforms require regular updates for security and performance. Operators should verify compatibility with existing energy management systems. Open protocols prevent vendor lock-in and protect long-term flexibility. Regular updates ensure charging infrastructure remains reliable and secure.
Future-Proofing for Higher Power Levels
Vehicle battery capacities continue to grow. Higher power chargers will become standard in coming years. Operators should install conduit and wiring rated for future power levels. This preparation avoids expensive retrofits later. Planning for 350 kW capability today protects tomorrow’s investment.
Maintenance and Reliability
Preventive Maintenance Schedules
Preventive maintenance keeps charging equipment operating reliably. Operators should follow manufacturer-recommended service intervals. Typical schedules include quarterly inspections and annual component replacements. Cable and connector checks prevent common failure points. A documented maintenance plan reduces unexpected downtime.
Spare Parts and Local Service Networks
Local spare parts availability affects repair timelines. Operators should identify regional suppliers before installation. TPSON maintains service partnerships across Chile. These partnerships ensure rapid response for critical repairs. Stocking common spare parts on-site further reduces downtime.
Uptime Guarantees and SLAs
Service level agreements define acceptable uptime thresholds. Operators should negotiate SLAs with clear performance metrics. Typical guarantees target 97–99% charger availability. Penalties for missed targets protect operator interests. Strong SLAs provide accountability and predictable service quality.
A private charging hub is economically viable for most Chilean fleet operators. Payback periods of 3–6 years and long-term savings make charging infrastructure a sound commercial investment. Operators should leverage government incentives, optimize electricity tariffs, and right-size hub capacity to fleet duty cycles. Early movers gain a competitive advantage as diesel costs rise and public charging remains insufficient. This guide shows that a clear strategy, supported by energy management tools from providers like TPSON, turns electrification into a profitable reality for commercial vehicles. Download our free checklist for evaluating your fleet’s charging hub feasibility. Chile’s fleet electrification is inevitable—the question is whether you lead or follow.
الأسئلة الشائعة
What payback period can a Chilean fleet operator expect from a private charging hub?
Most Chilean fleet operators achieve payback within 3 to 6 years. Fleet size, utilization rates, and government incentives drive this range. A 20-vehicle fleet typically reaches payback in 3 to 4 years. Larger fleets with high utilization perform even better.
How much does a private charging hub cost to build in Chile?
Capital costs range from CLP 25 million for small fleets to CLP 250 million for large operations. Hardware, installation, grid upgrades, and software drive these figures. AC chargers cost less than DC fast chargers. Operators should match equipment to their fleet duty cycles.
What government incentives exist for charging infrastructure in Chile?
Chile’s Electromobility Promotion Law offers tax breaks and accelerated depreciation. The Energy Ministry manages competitive funds covering 20–40% of eligible project costs. Regional programs in Santiago and Antofagasta provide additional grants. Operators should prepare documentation months before application windows open.
How does private hub charging compare to public charging costs in Chile?
Public charging rates range from CLP 180 to 360 per kWh. Private hub electricity costs range from CLP 80 to 140 per kWh. Off-peak charging reduces private costs further. Hidden expenses like queuing and detours add CLP 15–30 per kilometer to public charging.
Can on-site solar power reduce charging hub operating costs?
Yes. Chile offers exceptional solar resources, especially in the Atacama Desert. A 100 kW solar array generates 150,000–200,000 kWh annually. This output covers 20–30% of a medium fleet’s energy needs. Battery storage adds peak shaving and backup power capabilities.
What risks should fleet operators consider before building a charging hub?
Grid interconnection delays represent the most common risk. Technology obsolescence threatens long-term value. Operators should choose modular hardware and plan for higher power levels. Preventive maintenance schedules and strong service level agreements protect uptime. TPSON provides حلول قابلة للتطوير that address these concerns.
How does fleet size affect charging hub economics?
Larger fleets achieve better economies of scale. A 5-vehicle hub costs CLP 25–40 million with 4–6 year payback. A 50-vehicle hub costs CLP 150–250 million with 2.5–3.5 year payback. Infrastructure costs spread across more vehicles at scale.
What financing options help Chilean operators fund charging hubs?
Chilean banks offer commercial loans at 8–14% interest with 5–10 year terms. Green financing products provide reduced rates for electromobility projects. Leasing and Charging-as-a-Service models eliminate upfront capital outlays. Public-private partnerships suit large-scale projects at ports and industrial parks.